Media | Articles
2007 Hobby Survey Results
In September and October of 2007, Hagerty conducted its sixth annual survey of collector vehicle owners. Over 10,000 collector car owners participated in the survey, representing every class of collector vehicle, from antiques to tuners.
The results offer a glimpse into the life of a car guy and the hobby in general:
3-Car Garage
On average, we own 2.9 collector vehicles.
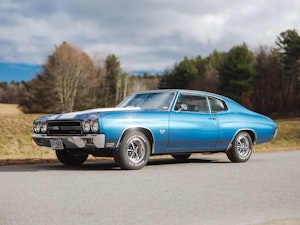
Postwar classics are the most common collector cars. 51.9 percent of us own a car in this category, while 38.5 percent of us own muscle cars.
Marketplace
Buy and sell classics with confidence
Call us Car Guys
Nope, we’re not “collectors” or “hobbyists.” Over 40 percent of us consider ourselves a “car guy,” followed by “enthusiast” at just over 19 percent.
We’re Joiners
Over 50 percent of us belong to one or more car clubs.
It’s a Family Affair
Sixty-seven percent of us share our love of the hobby with a family member. In most cases, it’s our husband or wife or son, with each category accounting for about 20 percent of responses.
Middle-Age Entry
The most common age of hobby newcomers is 46 to 55.
Memory Lane
Thirty-two percent of us own a car that was new at an important phase in our lives, with the high school and teen years accounting for close to 50 percent of these reference points.
One respondent summed it up by saying, “Back in high school we used to ride around in my buddy’s Olds 442. Those were the times of our lives.”
I’ll Take Mine Stock, Please
Just over 40 percent of us believe classic and collector vehicles should be kept stock because preserving them protects their history and value.
“One hundred or two hundred years from now people will want to see, and will appreciate seeing, what a stock 1959 Cadillac actually looked like. I don’t think they’d want to see a lowered version, painted purple, with flames, a carpeted dash and 22” wheels,” said one respondent.
Buying and Selling
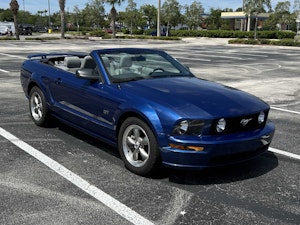
Over 64 percent of us have purchased a collector vehicle in the last five years. The top three models we’ve purchased most recently are the Corvette, the Mustang and the Camaro.
Direct purchases from other collector vehicle owners continues to be the most common means of purchasing a collector vehicle – over 50 percent of us purchased directly from a friend, family member or other private party. Regardless of the method we chose, the majority of us are satisfied with the overall purchase experience, including price, ease of transaction, condition of vehicle, availability of desired model, trustworthiness, etc.
While fewer of us (26.5 percent) have sold a car in the last five, our selling channels tend to mimic our purchasing channels.
Driving
On average, we drive our collector cars about 2.5 times per month. Most of our driving occurs in March through November.
When it comes to our regular-use vehicles, about one-third of us drive trucks. And, we tend to be loyal to our favorite brands – often our daily driver is the same make as our collector vehicle, with Chevrolet just edging out Ford as the most popular brand of regular-use vehicle.
Hands-On
We’re a hands-on group when it comes to working on our cars. We spend an average of twelve hours per month on do-it-yourself projects. Tasks we’ve performed most often ourselves include: cleaning, polishing and waxing; changing or maintaining a battery; changing oil and/or oil filter; changing and filling fluids; replacing or installing lights; replacing spark plugs; adding parts; and performing tune-ups. When it comes to repairing body damage and replacing tires, we’re more likely to turn to others for help.
Why do we do it? The majority of us report that enjoyment is the number one reason we choose to work on our cars ourselves.
On average, we’ve spent $6,275 restoring, repairing, improving and/or maintaining our collector vehicles in the past year.
Our Concerns
Big Brother appears to be the biggest threat to the hobby – 37 percent of us are concerned about government regulations that could limit the usage and enjoyment of our cars. We’re not too concerned about gas prices, but the effects of ethanol and reformulated oils on our cars are definitely on our radar. We’re also concerned about low hobby interest among younger generations.
Poor George, and Other Fun Facts
When choosing a favorite Beatle, car guys favor Paul with his smooth voice and pop sensibilities. John is next, followed by Ringo and George.
Over 67 percent of us are republicans. Also, generally speaking, we don’t smoke, have tattoos, piercings or facial hair. We prefer denim over linen, Coke over Pepsi, coffee over tea, beer over wine, chocolate over vanilla and dogs over cats.


