Media | Articles
Which classics are the safest bets and which are risky business?
In classic car circles you hear a lot about the difference between collectors and investors, as if they’re warring tribes. Truth is, most of us are little of both—it’s possible to love Old Car Smell and at the same time be savvy about what things are worth. The sharper distinction is between everyday investors, who primarily look for stability, and those who are purely chasing growth. You know, speculators. It’s the difference between the family who takes out a mortgage to buy a house and hopes they’ll make a bit when it’s time to sell in a decade and subprime mortgage bundlers.
The vast majority of car collectors—including those who work here—fall into the former category. Which is why the current market, in spite and because of its astronomical appreciation, can make us a bit jittery. Appreciation is nice, but what about stability?
In fact, there’s a lot of stability in the classic car world. You just need to figure out where to look. Hagerty Insider does this regularly by calculating vehicles’ annualized volatility score. Considering vehicles that have run in the Hagerty Price Guide for at least 3.5 years, our data analysts plot percent changes in value over time.
A lower score denotes the car’s market value is fairly stable, with higher scores indicating volatility—they can swing wildly from one price guide update to the next. Keep in mind that volatility—or lack thereof—does not indicate the car in question is a good or bad buy. In fact, these are often the cars on which you can make out like a bandit. And if you’re willing and able to hold through the dips, you can simply wait for the right time to cash in. These are not, however, the ones to bet the farm on.
Most volatile
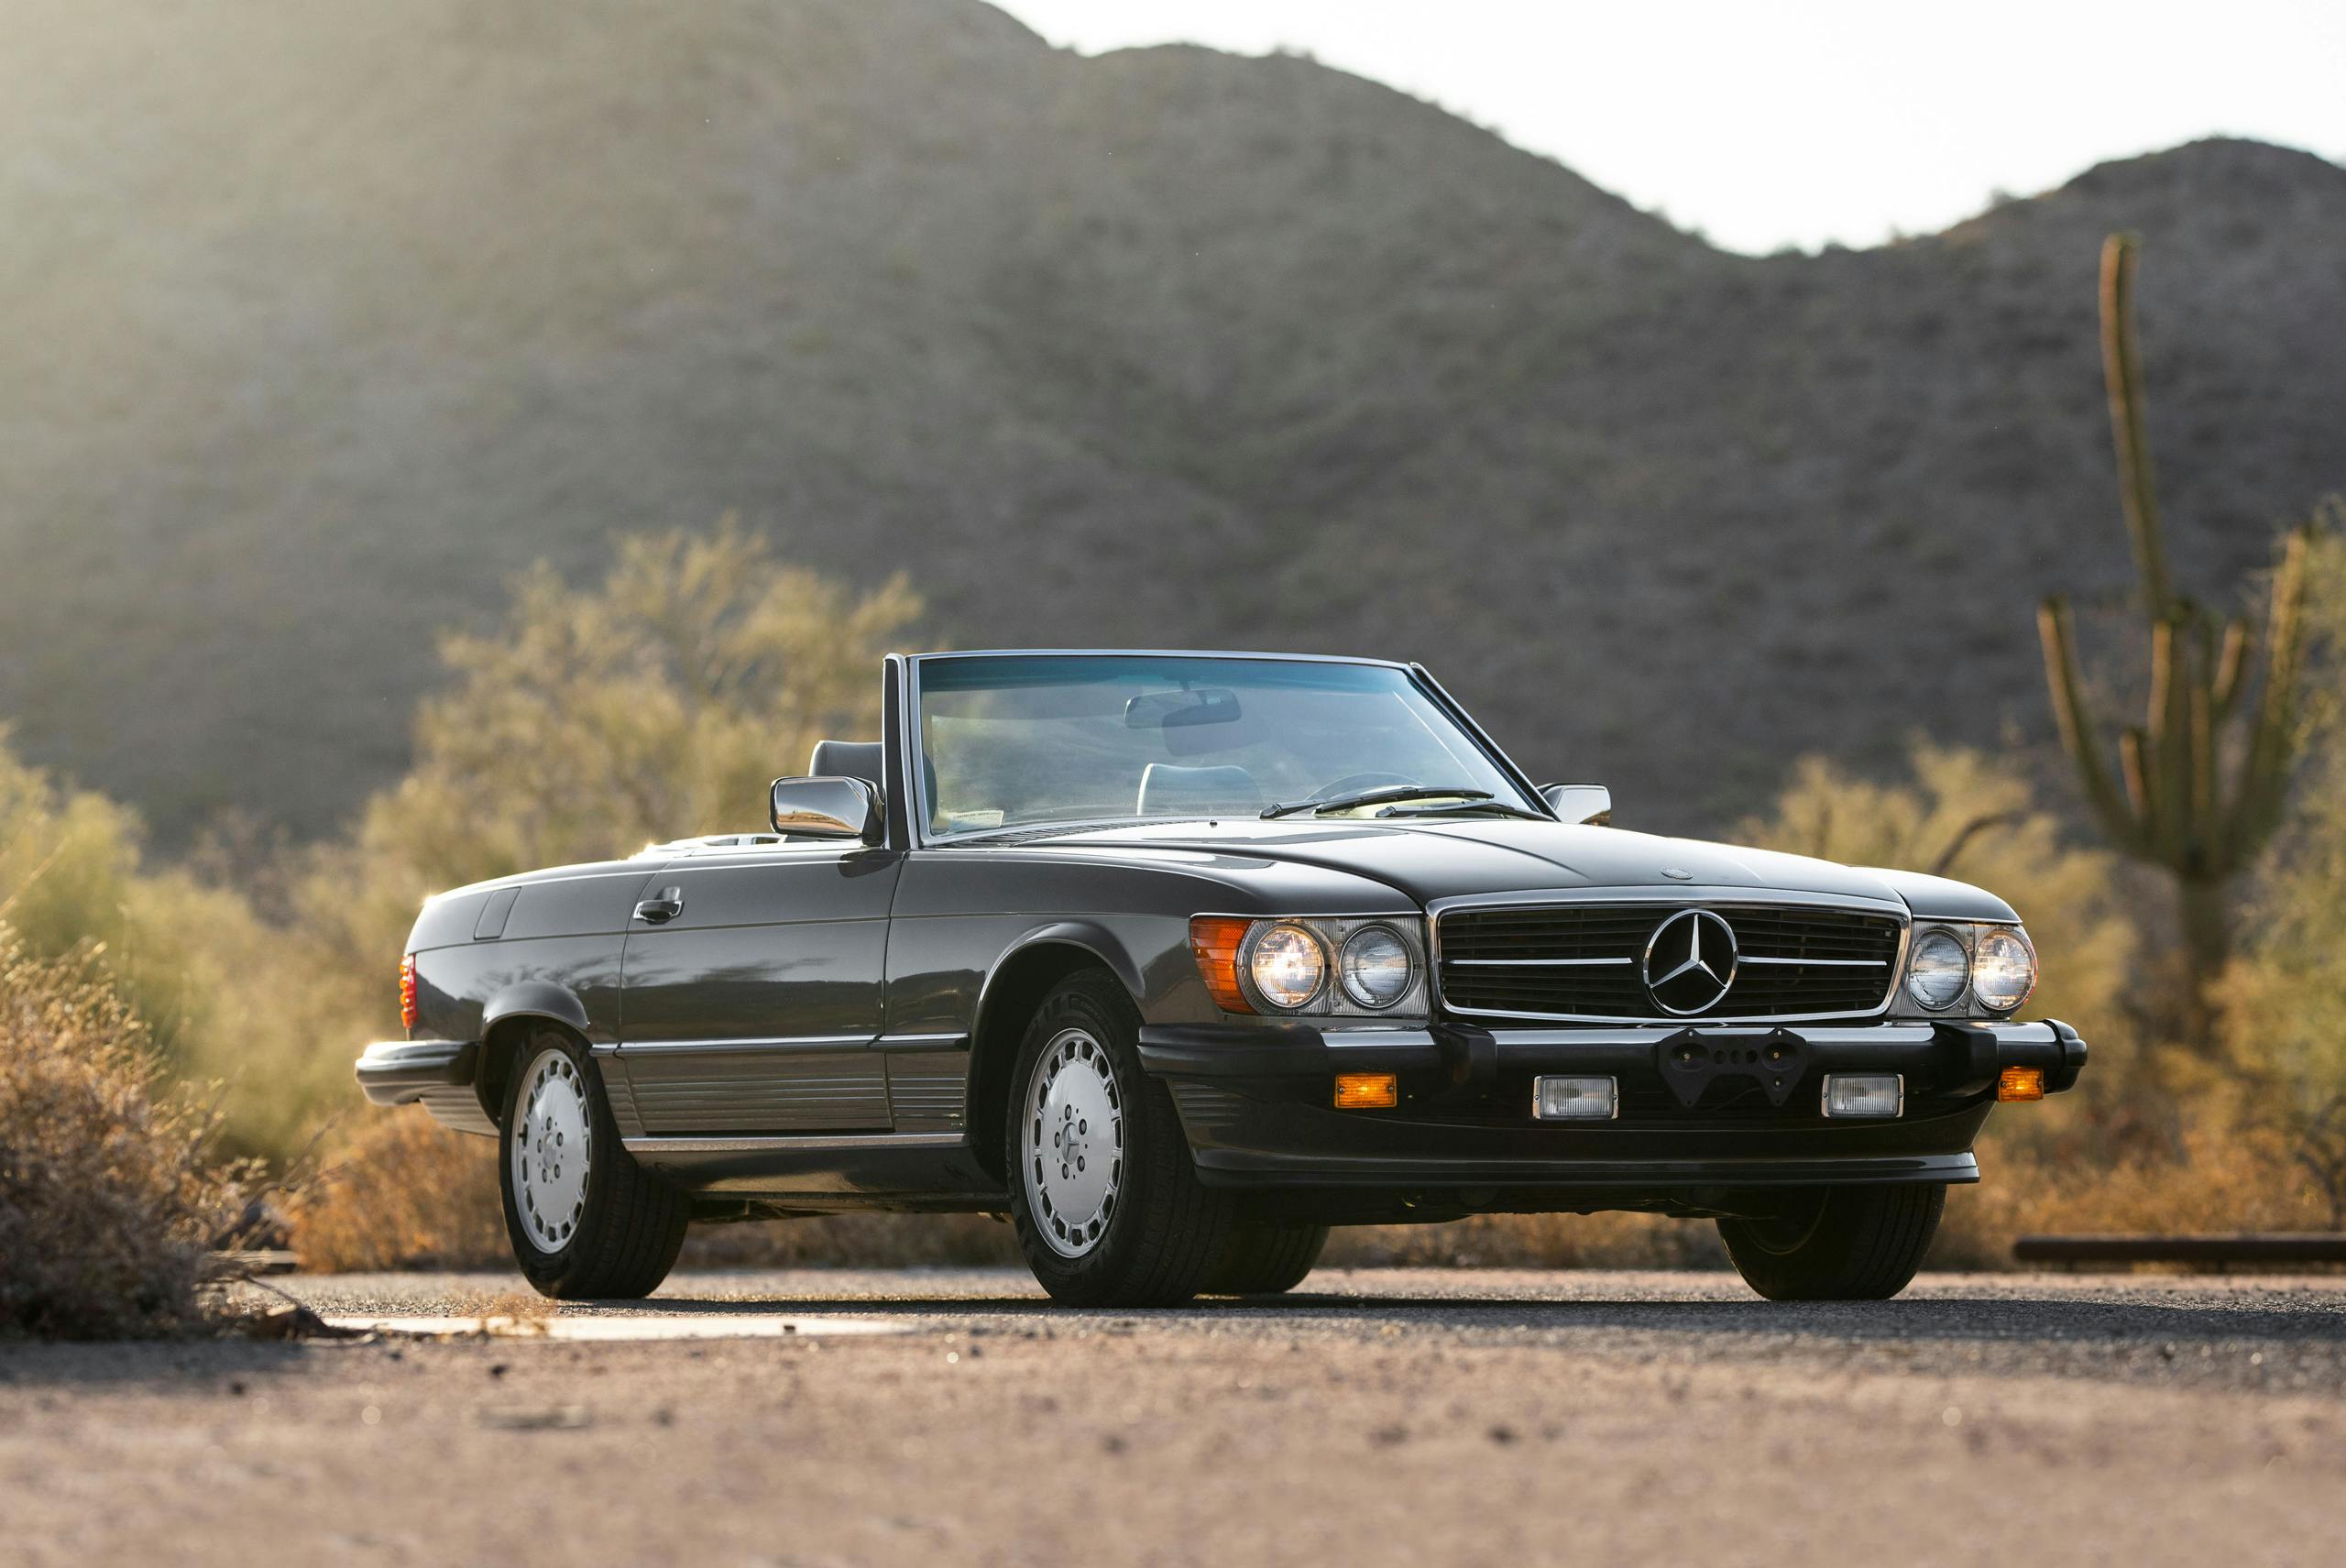
1986–1989 Mercedes-Benz 560SL
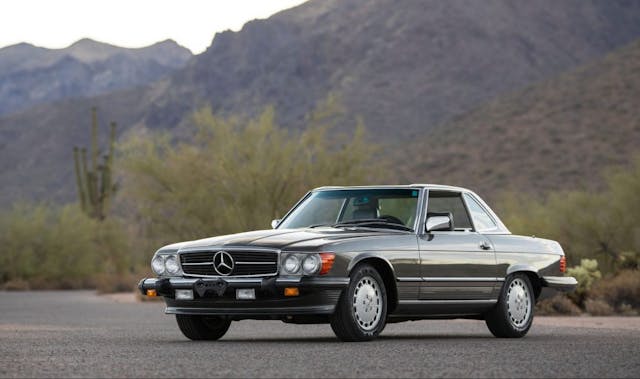
Annualized volatility score: 28.3 percent
Marketplace
Buy and sell classics with confidence
The rising values of 1980s Benzes continue to keep us entertained. The creamy, cushy R107-generation 560SL is one of the hotter buys right now, as evident from its increased inclusion on major auction dockets across the country. The biggest spike in value occurred back in 2015 when we saw a 100 percent increase, but the plot graph shows a wild variance of values as we continue through 2022.
Vehicle condition factors heavily here. Pristine examples (Condition #1) have dipped less often than the basket cases (Condition #4). However, the complexity of these vehicles means that turning the latter into the former typically doesn’t pay. The old adage applies here—buy the best example you can afford.
1988 BMW M5 (E28)
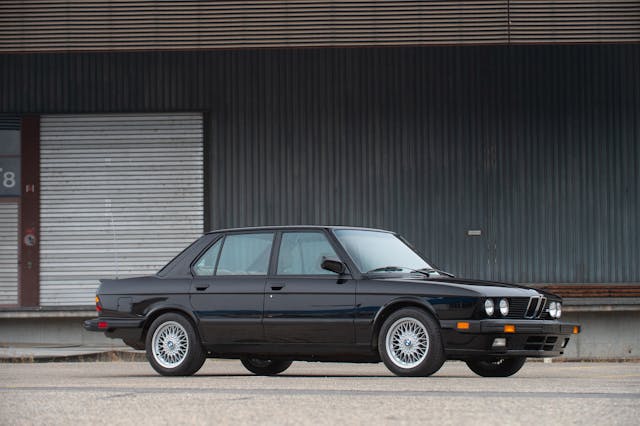
Annualized volatility score: 38.6 percent
Another factor in the volatility of newer collectibles is that not every seller has gotten the memo that they are, in fact, collectible. That applies to the 560SL and also to the runner up on our volatility list, the 1988 BMW M5. Those of us who refresh Bring a Trailer every morning know they're growing in value, but away from the spotlight, there are still retired dentists selling tired M5s to twentysomething enthusiasts for fun money. The price realized for any given M5 thus can vary depending on who is selling and who shows up to buy.
1989–1991 Chrysler TC by Maserati
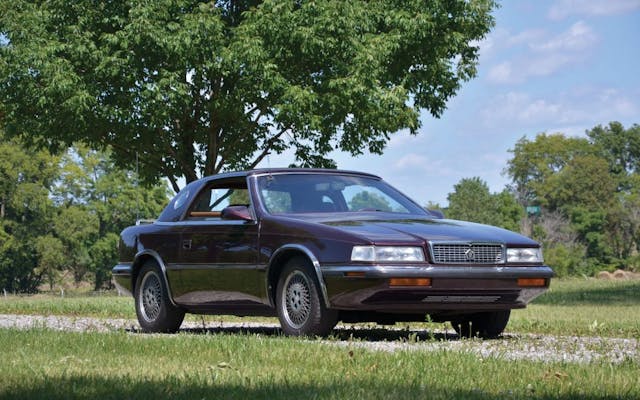
Annualized volatility score: 31.1 percent
At the risk of getting all Warren Buffet here, one of the things to consider with any investment is its intrinsic value. Assessing that can be tricky when it comes to cars—we all love what we love—yet there are factors to weigh. Beauty. Performance. Racing pedigree. Historical significance. The cars that peg the needle on all those are worth the most money and also tend to be the most stable. Come what may, a Mercedes-Benz 300SL will always be worth a lot of money to someone, because it has intrinsic value.
A Chrysler TC by Maserati, to put it very kindly, has less intrinsic value than a 300SL. The tarted-up K-Car has, like fanny packs and compact discs, benefited from a combination of Gen–Xers' nostalgia and Gen–Zers' appreciation of irony to the tune of some major increases in recent Hagerty Price Guide updates. But it's also taken a few dives, which makes sense.
That's not to say the TC can't be desirable. The optional 2.2-liter turbo four-cylinder was something of a screamer, with Mahle pistons and a Cosworth head. Better still, it came with a five-speed manual transmission. Not bad for a ride that can still be bought in decent shape for four figures. But if you're betting on future appreciation, be aware it's just that—a bet.
2017–Present Ford GT
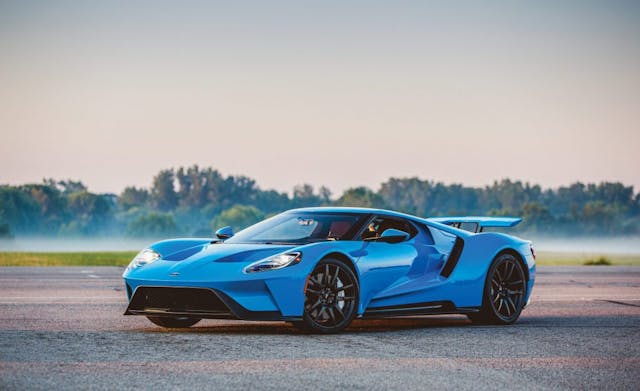
Annualized volatility score: 29.6 percent
The new Ford GT’s volatility index graph paints a cautionary tale for would-be speculators. For the most part, it appears the people scraping the most cash off the GT’s carbon fiber hood are original owners who sell their low-mileage cars for double—and sometimes triple—the original purchase price.
We’d also reckon a portion of the volatility rides on spec differences and special editions, along with Ford’s periodic announcements of extended—or ending—production of its second-generation supercar.
Of course, the above factors really only matter in the short term. Down the road, it's hard to imagine these LeMans-winning supercars going anywhere but up.
Least volatile
1961–1964 Pontiac Bonneville
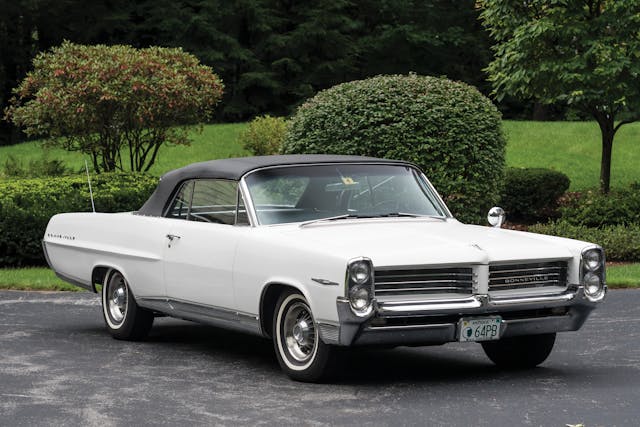
Annualized volatility score: 2.2 percent
This big-body Pontiac might not have the same fervent following as the later GTO, but the third-gen Bonneville is one of the most stylish and elegant American cars from the early 1960s. It’s also one of the most predictable on the market, with just a 2.2 percent volatility rating. Aside from a recent mini-spike in value, the ‘ol Bonnie is sturdy and stable; outside of the rare 421 Super Duty, these fall into the “cruiser” category, with most owners opting for casual drives rather than explosive light-to-light pulls. As such, the pool of Bonneville buyers is familiar and unwavering.
1955–1957 Pontiac Star Chief
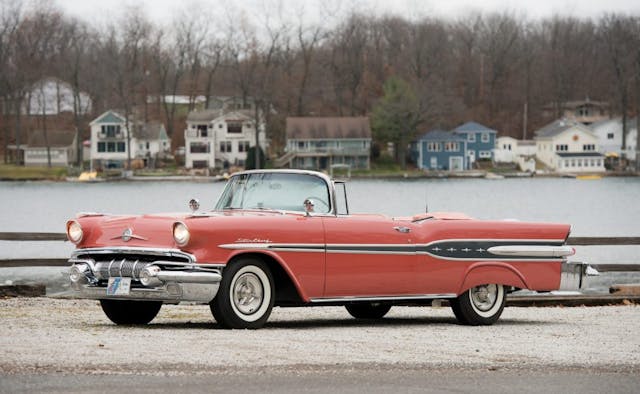
Annualized volatility score: 1.6 percent
Another show cruiser from Pontiac. A quick glance at the plot graph might have you thinking values of the Star Chief are all over the place, but those variances show a slide of only around 1.6 percent when averaged out.
1953–1955 Triumph TR2
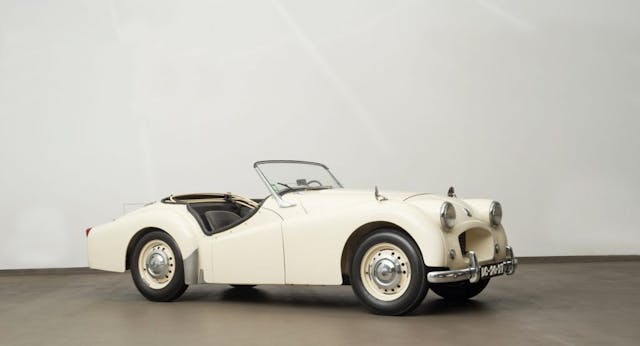
Annualized volatility score: 1.7 percent
As we noted in a recent Sale of the Week, British roadsters are common, affordable, well-known, and the merits of ownership have long been established. So, you know what you’re getting when you get one, and so does the enthusiast on the receiving end when you decide to sell.
1957–1972 Lotus Seven
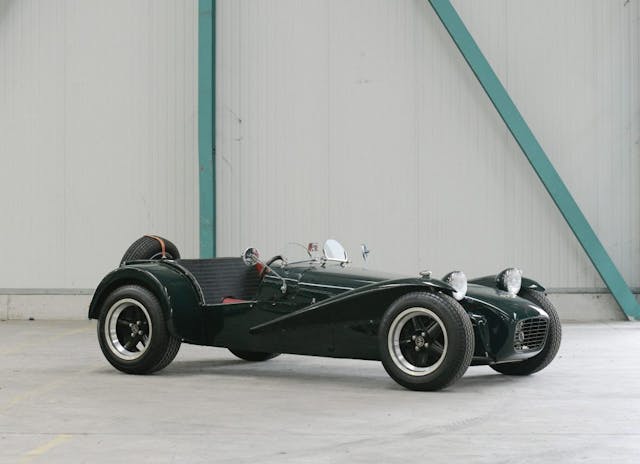
Annualized volatility score: 1.8 percent
Funny, we wouldn’t have pegged the peaked-out, hard-nosed, ultra-spartan Lotus Seven to be associated with anything remotely “stable.” But, our updated Hagerty Price Guide shows a tidy 1.8 percent rate of volatility; likely another case of cars sought by a fixed pool of buyers, as these are hardcore cars with absolutely nothing in the way of creature comforts. Most of the sinusoidal action on the Seven’s market chart rises (or falls) between baseline (zero) and a peak of five percent, but keep an eye on Sevens going forward—our January update saw a four percent boost.
