Media | Articles
Is the market as hot as we think?

Many market watchers and participants have been amazed at how hot the collector car market has been since the pandemic began. Auction results have exceeded expectations. The Hagerty Price Guide has seen broad appreciation. Everything from Ferrari F40s and Porsche Carrera GTs to Mitsubishi 3000GTs seems to be hot.
Of course, the natural question that comes with a market that’s going up is, “When will it go down?” When do people decide that they’re spending at an unsustainable rate? When do speculators become the driving force? When do new entrants to the market get turned off?
By one metric, that may already be happening.

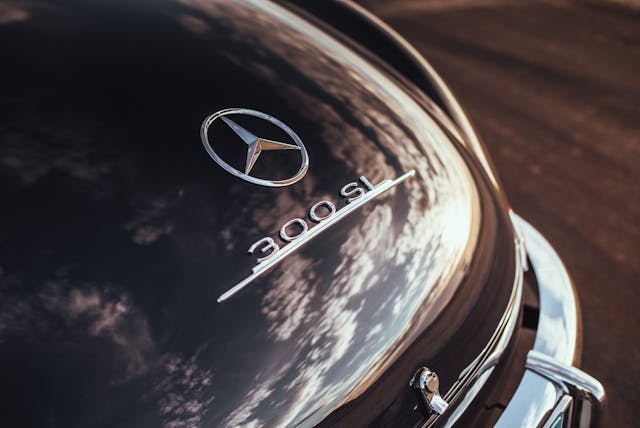
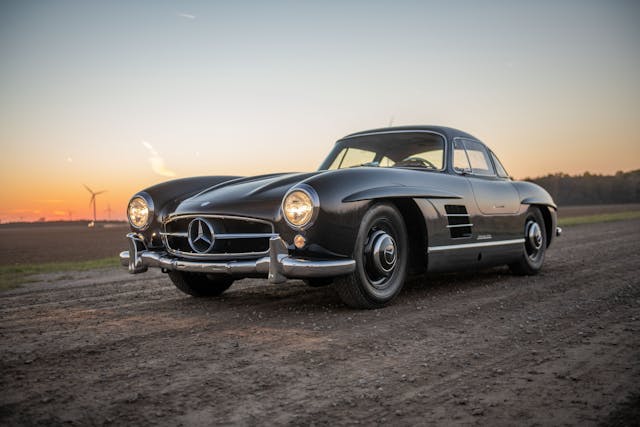
Longtime readers will remember our 300SL Index. Newcomers can learn more here. The TL;DR version is that by looking at repeat sales of the venerable 300SL, we get a snapshot of the market that’s free of the “noise” of big one-off sales. (As we’ve noted before, bidders in the seven-figure-and-up bracket are willing to pay a premium for cars that haven’t changed hands in many years.) The index is less volatile because it doesn’t contain the less desirable examples that are hard to sell—it also excludes the highly original long-term owner cars, as well as alloy-body cars like the one that just set a record.
Reduced volatility makes it a bit easier to observe turning points. Such as peaks in 2000 for the dot-com boom, a February 2008 peak before the financial crisis, and a more recent peak in late 2012. More relevant today, though, is the post-pandemic bump. It’s there, but only at a moderate level. The index suggests that it’s less significant than you might think judging solely by average sale price and, more important, that the market is already cooling.
Marketplace
Buy and sell classics with confidence
Of course, any single indicator is just that—a single indicator. We at Insider look at lots of indicators, many of which say the market still has the pedal to the metal. Yet it is precisely in such times that it's important not to disregard flickering warning lights.


