3 classic cars that have rock-solid values—and 3 that are wild cards

He gets on base.” If you follow baseball—or have seen the movie Moneyball—you’re probably familiar with the quote. The notion is that it’s better to have a player who gets on base consistently than one who hits more home runs but also strikes out frequently.
There’s a similar concept in car collecting: volatility. It’s important but frequently gets overlooked in favor of shinier stats like Hagerty Price Guide value and appreciation.
This story originally appeared on Hagerty Insider. For a deep dive into collector car values every Sunday, sign up for the Insider newsletter.
Volatility, in investment terms, refers to how much the value of an asset sways around the mean. Two cars might have the same value today, but if one is more volatile, you’ll have a harder time predicting what it’ll be worth when you’re ready to sell.
Fortunately, we can track volatility in classic cars. Every four months the Hagerty Price Guide is updated with new market values, and we can use these data to look back at what the most and least volatile cars are. Using vehicles that have been in the HPG for at least 3.5 years and up to six, we calculated the volatility and plotted the percent changes over time to come up with an annualized volatility score. A low score means the price is relatively stable. Higher means more volatile, and that it’s hard to predict how much that vehicle’s value will change from one HPG to the next.
To be clear, we are not saying the most volatile cars are bad. In fact, many of these cars are appreciating quickly, and over the long term are almost certain to continue their upward trend. And just as a good batting lineup weighs risk against reward by including both a lead-off hitter who frequently gets on base and a slugger who can bring everybody home, a balanced car collection might have vehicles that are stable in value as well as some riskier ones that could achieve big gains. But if you’re buying with the expectation of breaking even or making a profit in the short term, beware that volatile cars can pay off big but also leave you high and dry.
With that in mind, here are some of the most volatile and most stable classic cars.
Swing for the fences (The most volatile)
Many of the cars that move the most come from Germany, specifically newer models from Porsche and BMW. This isn’t surprising. These cars have appreciated sharply as they’ve made the transition from used to classic car, and most appeal to the younger collectors who will be driving the market for years to come. Yet they are also subject to fluctuation as speculators jump in and prices overheat. We expect this volatility to ease as the segment matures, but in the short term, buckle up.
1988 BMW M5 (E28)

Annualized volatility score: 41 percent
BMW E28 M5s are rare, and really nice ones are particularly hard to come by, given that most were until recently used as daily drivers. That also means the people who buy them fall into several camps—collectors buying to preserve a vanishing classic, speculators who see future gains, and enthusiasts who still think it’s an affordable performance car to drive day in and day out. When a good example comes up for sale, the price can vary depending on who is bidding or buying—the collector or the driver. This is common for 1980s and ’90s performance cars: We think they’re classics, but not everyone has gotten the memo.
It’s cars like this that see volatility like no other. One day values can rocket up, then the next they crash back to earth. In the E28 M5’s case, the volatility score of 41 percent means that, 95 percent of the time, the annual HPG change will be within 41 percentage points of the average change measured over the last six years. That’s one huge window.
1975–89 Porsche 911 Carrera (Turbo 930)

Annualized volatility score: 30 percent
The Porsche 930 had very large value increases in 2015 (nearly tripling in a year) followed by long declines ever since. Those declines haven't been predictable, though, and this is where the volatility comes in. Some years the car dropped 10 percent, others 3 percent, and sometimes 0 percent, and this is after huge increases. Getting in and out during a 0 percent year is lucky, but selling during a 10 percent year is not. Annual percent changes should fall within 30 percentage points of the average percent change, and it's anyone's guess as to which direction and what percentage.
1980–91 Audi Quattro

Annualized volatility score: 42 percent
The Audi Quattro falls into a volatility range similar to that of the M5, for similar reasons. Excellent ones don't come up for sale often, and when they do, the price depends on who is waiting to buy. Percent changes range from 140 percent increases to 10 percent decreases and everything in between. Plus, Quattros are getting speculative attention in the current market, and that often leads to big swings in values. With the Quattro we can say that 95 percent of the time the percent changes will be within 42 percentage points of the mean. In other words: Don't use past performance to predict future performance.
The lead-off hitters (Least volatile)
If you can't stomach volatility, we have one clear bit of advice for you: Buy American. Sixteen of the 25 least volatile cars are domestics. Consider this the flip side of stories we've published about values of American cars, particularly newer ones, being flat. We also see low volatility for older classics that have been considered collectible for a long time, for the same reason that long-established companies like IBM tend to have stable stock prices—they're mature. Those who get a thrill out of flipping cars might have another word for it: boring. But if your chief ambition with a car is to enjoy it for some time and then get back what you paid for it when you're ready to sell, low volatility means safety.
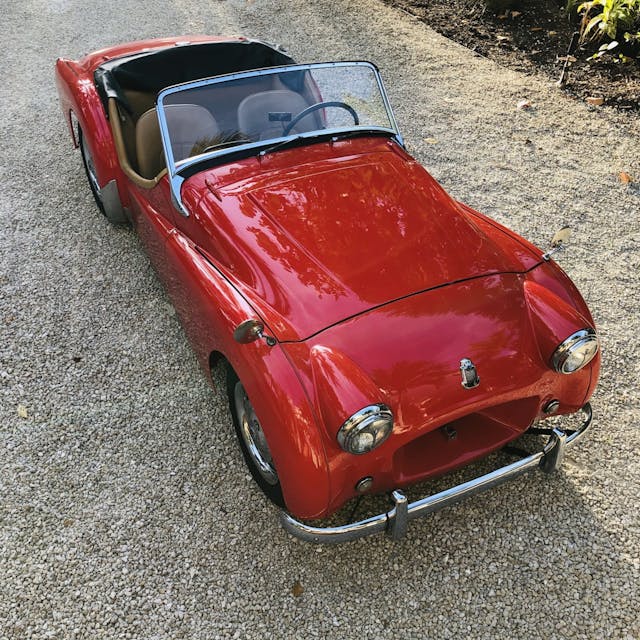
Triumph TR2

Annualized volatility score: 1.1 percent
Triumph TR2 values have had numerous value changes over the last six years, some up and some down, and these reflect buyers paying a little bit over or a little bit below the norm; but we never see any crazy swings of interest or lack of interest. This is the norm for British roadsters. They remain relatively affordable, are longtime classics, and many owners are frequently trading them. With an annualized volatility score of 1.1 percent, we can say that 95 percent of the time the annual change will be within 1.1 percentage points of the average change over the last six years. Buy with confidence knowing that historic changes with this car will likely remain relevant predictors.
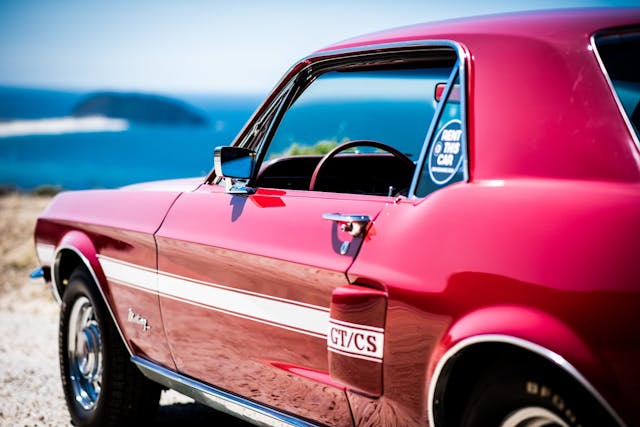
1965–73 Ford Mustang

Annualized volatility score: 1.2 percent
The Mustang is one of the most collected cars in the world, and it appeals to enthusiasts of all generations—millennials love them as much as baby boomers. With supply high and demand constant, values never make drastic moves. The largest changes in the last six years have been 3–4 percent. Intermixed are 1 percent increases or drops. That means that the first-generation Mustang isn't a car you're going to get rich on. But it will maintain its historical value trajectory.
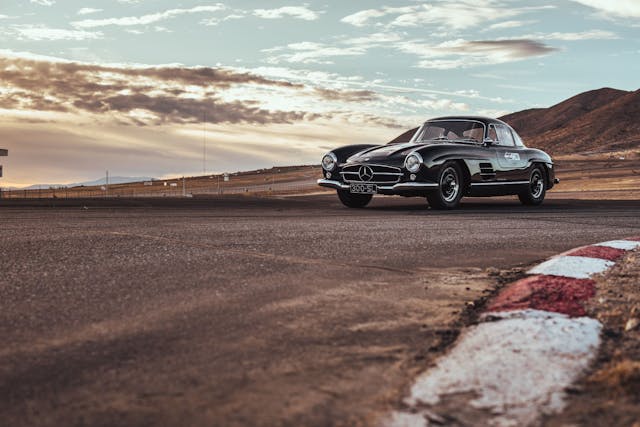
1954–63 Mercedes-Benz 300SL

Annualized volatility score: 1.7 percent
The 300SL is a car that has been up, down, and up again. That sounds like a volatile car on the surface, but in that six-year window the maximum change was only a 4 percent decrease and the median change was a 1 percent decrease. That leads it to an annualized volatility score of 1.7 percent—meaning that 95 percent of the time the annual change in value is going to fall within 1.7 percentage points of the historical mean. That means value changes are fairly steady, even if they're never quite standing still.

